


I didn't update my old graphs but my scale keeps documenting my weight. You can see where the 2 pregnancies were!
 |
| Monthly Weight - updated May 16, 2015 |
It's funny. Everyone thought how much healthier we'd be in CA but without a job, I was less healthy even though I worked out more so I gained a lot of weight.

Since there are so many years on the Monthly graph, I decided to do one with the years when I was in CA. The pregnancy weight took a lot longer to come off than it did to go on.

Since there are so many years on the Monthly graph, I decided to do one with the years when I was in CA. The pregnancy weight took a lot longer to come off than it did to go on.
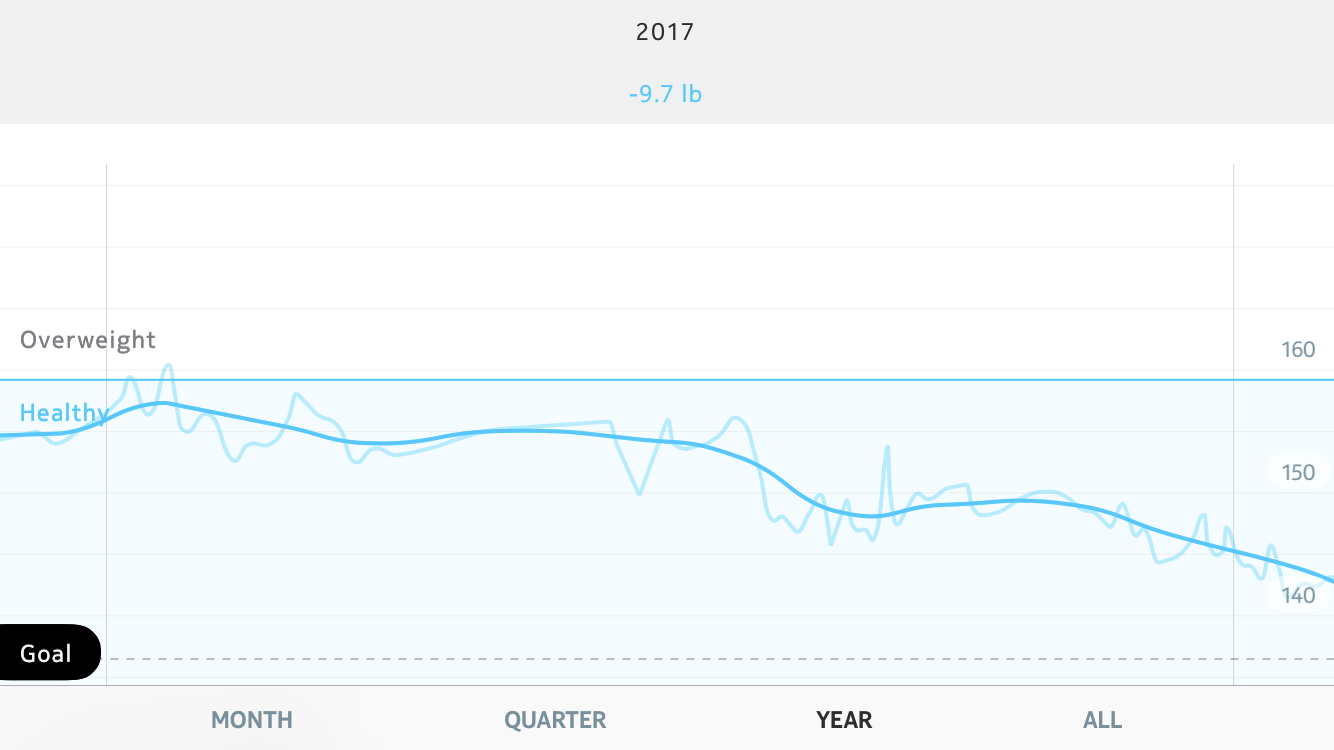
 |
| Weekly Weight - updated May 16, 2015 |
The graph is a bit interesting because of pregnancy.
 |
| Daily Weight Readings |

| min | max | difference | |
| 2003 | 123.8 | 133 | 12.2 |
| 2004 | 118.4 | 128.6 | 10.2 |
| 2005 | 115 | 124 | 9 |
| 2006 | 116 | 125 | 9 |
| 2007 | 119.6 | 127.6 | 8 |
| 2008 | 123.4 | 133 | 9.6 |
| 2009 | 124.4 | 133 | 8.6 |
| 2010 | 124.2 | 132.8 | 8.6 |
| 2011 | 124.6 | 136.2 | 11.6 |
| 2012 | 122.6 | 139.2 | 16.6 |
| 2013 | 129.3 | 177.4 | 48.1 |
| 2014 | 125 | 157.3 | 32.3 |
| 2015 | 122.8 | 134.7 | 11.9 |
A new addition is the ranges I have had of my weight each year. The min and max are anywhere within the year. The difference is fun to look at.

A few graphs just for specific years. I used to only put the current year on here but since the last update was mid 2013, I'll include 3.


Here's a way to track my weight gain due to marriage (but I didn't weigh myself on my wedding day. I wanted to take a scale so I could but i didn't. I regret it. I will never know my exact weight on my wedding day. I had to go by the 2 days before weight.

I got a BodyMedia Fit and put together some data about calorie burn on my blog.
Average Calories I burned each week since I got a gowear fit (Summer 2010 and Summer 2011, I didn't wear my armband in public with short sleeves and had to use edit off body so that data is probably low.)

Here is a monthly average of the physical activity. It is easier to look at to get a rough idea. Note that in the summer summer, I went a lot of days without wearing the armband to work and I did not edit all the off-body data that I could have, so it is low.

My graphs are a bit excessive. If I admit that, I know it's bad. BodyMedia Fit gives you 28 days worth of data at a time. Here are some examples of what you get directly from the software.
Some of the really low step days are days I didn't wear the armband for part of the day. I have not tried to alter that data, but I do try to wear clothes that do allow for my armband to be worn.
You also get personal bests. As you can see, I wear my armband more than the recommended 23 hours a lot. Also when you change time zones you get more than 24 hours in a day.

(More graphs to be added soon. Better descriptions too.)
No comments:
Post a Comment