
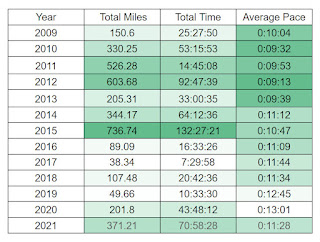
In September I made a post about Running Numbers. I did some pivot tables after that and I've been using them so thought I'd share more.

I thought more fun than yearly average pace would be monthly. I almost look at this daily to see how my latest run affected the monthly average. I know all runs will affect it especially since easy runs should be 1-2 minutes slower than race pace.

I tried to figure out how to do a pivot table for weekly totals but couldn't. Luckily my data added it up weekly so I pulled the date every Sunday and then what my total was for that week.


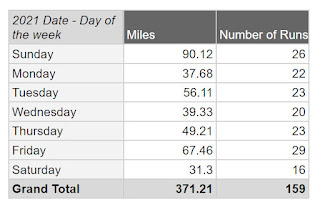
Just for curiosity sake I wanted to see how many miles I ran on whatever day of the week. Sunday is usually my long run day so it makes sense Saturday is low. I was surprised about Wednesday.
I realize probably nobody else cares about this at all but I care now and I love looking back at old running data posts I made so I'll definitely like it in the future. I love the snapshots in time. I love going for another run just to see what it does to everything.
No comments:
Post a Comment